Data Analytics
Copag Sales Dashboard
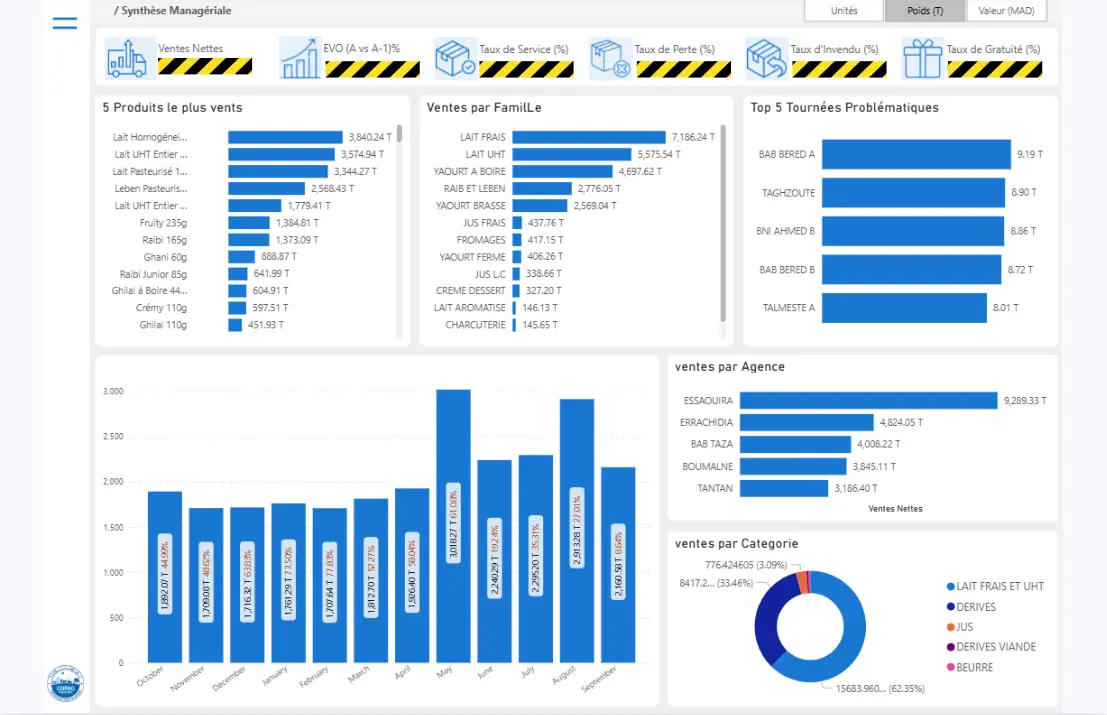
A Power BI sales dashboard that consolidates and monitors sales across several Moroccan cities, built on data migrated from legacy systems.
- Client
- COPAG, dairy cooperative
- Role
- Data analyst and BI developer
- Period
- Jul 2025 to Sept 2025
- Status
- Delivered
100M+
records migrated from legacy systems
3
views: by agency, product and category
1
dashboard for all cities
The challenge
Sales figures lived in legacy systems and spreadsheets in each city, so managers could not compare agencies, products or periods in one place.
What I built
Python ETL scripts cleaned and validated the legacy data into SQL Server. A Power BI model with DAX measures drives dashboards by agency, product family and category, with a dynamic sidebar for filtering.
The outcome
Management reads sales by agency and product from a single dashboard instead of separate files. The data migration behind it covered more than 100 million records.
Key features
- Sales by agency, product family and category
- Dynamic filter sidebar
- Automated Python ETL with validation and logging
- DAX measures for revenue, volume and rate KPIs
Screens
Sales By Agency1 / 3
Stack and tools
- Python
- DAX
- ETL
- SQL Server
- Azure
- Data
- Power Bi
- Visual Studio 2019
Need something similar?
Book a free 30-minute call to talk through your project. After the discovery call, once the scope is clear, you get a fixed written quote in MAD.